
Beyond the 9 to 5: Occupations with the Worst Drivers
Your job determines where you drive and when, but it also can influence how good you are at it.
Your driving behavior is, among other things, a product of your schedule and lifestyle. The amount of time you spend on the road, and the hours of the day during which you’re out and about, whether commuting to work, meeting up with friends, or giving rides to family members, may influence the types of traffic incidents you’re likely to experience. For those who work in the rideshare, taxi, or trucking industries, for example, their line of work is on the road itself, and the countless hours they log on the road impact the types of incidents they are regularly exposed to.
The coronavirus pandemic and subsequent limitations on how businesses can stay open and which social activities are permitted has had an unprecedented impact on driving behavior in the United States. On the one hand, rush hour has lost its significance in the age where many non-essential workers, privileged enough to keep their jobs remotely, are working from home. On the other hand, many essential workers have been forced to continue working in person throughout the pandemic despite safety concerns, or they have been laid off altogether. At the same time, limitations on public transportation use have brought more people out on the roads than ever. According to Apple’s COVID-19 Mobility Trends Report, as of November 2020, the volume of public transit use in the United States has decreased by 51% from January 2020, while the prevalence of driving has increased by 8%. With this influx of drivers, incidents are bound to occur.
The landscape of work as we know it has been irrevocably changed in 2020. Alongside these changes in the workforce, how we drive, and how often we do, have shifted as well. To further understand the relationship between these shifting driving behaviors and workforce trends, the data science team at Insurify crunched the numbers to identify the occupations with the most violations on record in 2020.
Insights
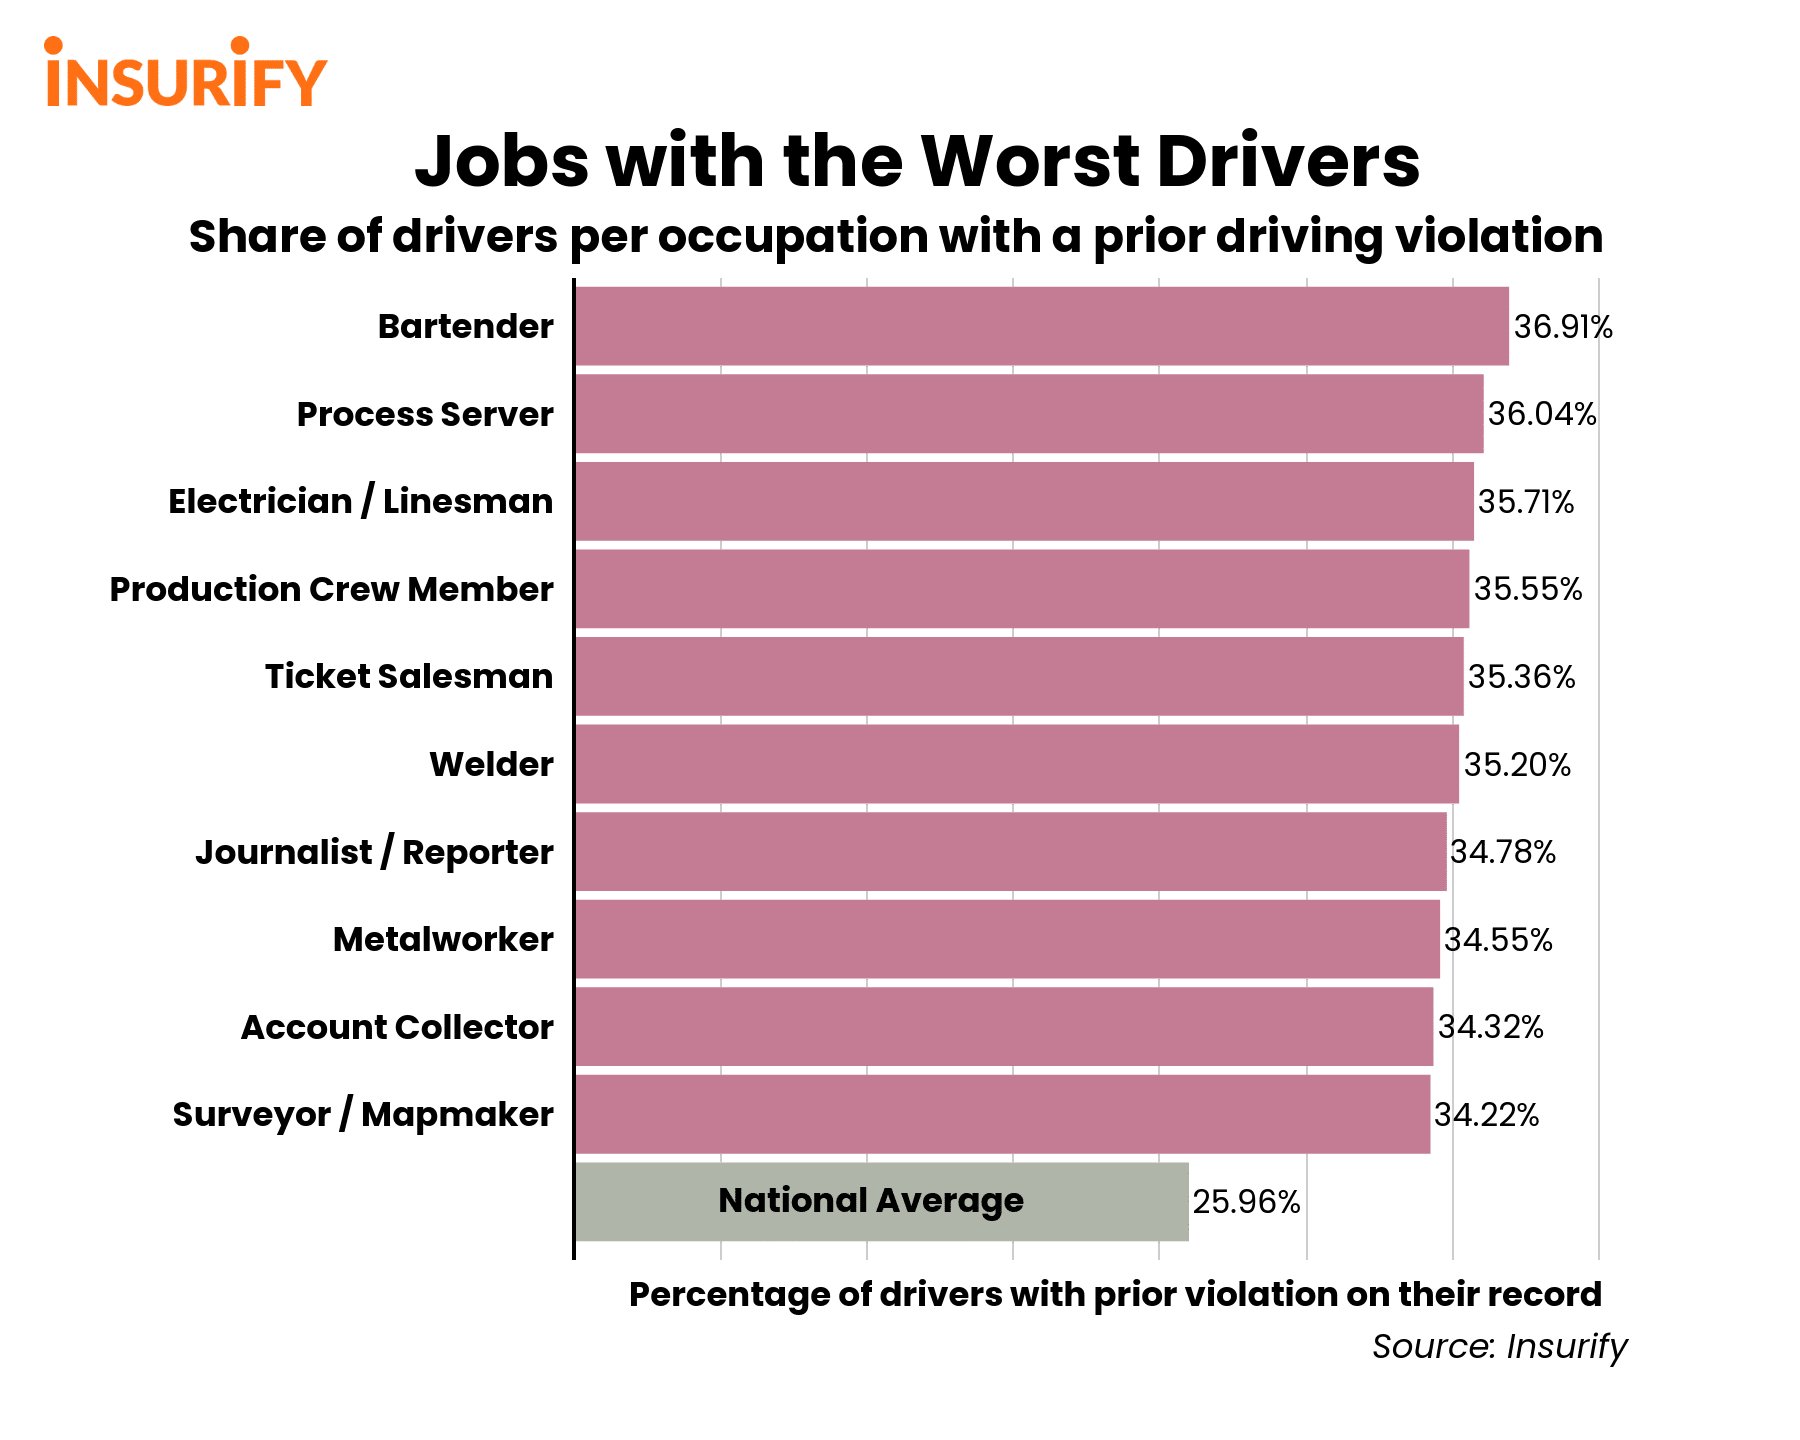
- National average. The average rate of traffic incidents across all occupations in the United States is 25.96 percent. Rates of accidents and speeding make up 13.71 percent and 13.01 percent, respectively. The U.S. Bureau of Labor Statistics reported that the median annual wage in America is $53,490, as of 2019.
- Accidents abound. The most common incident type varies by occupation — among the ten jobs with the worst drivers, half of them are most prone to speeding, while the other half get into accidents more frequently. However, the jobs with the worst overall incident rates also tend to be the most accident-prone.
- Diverse industry representation, but similar underlying pay grade. The ten jobs with the worst drivers come from a wealth of different industries, including hospitality, law, manufacturing, and media. Despite the lack of uniformity among these occupations, the majority of these jobs are unified by their pay grade — 8 out of the 10 jobs on the list have a median annual wage that’s at least 6 percent lower than the national average.
- Stressful conditions may contribute to more driving incidents. Another unifying characteristic of these jobs is that many of them operate outside of the typical 9-5 office workday, with factors like longer hours, night shifts, or intensive manual labor. Drivers with these jobs may operate their vehicle when fatigued, resulting in inattentiveness on the road, or they may drive at unorthodox hours when road conditions are more dangerous.
Methodology
To determine which occupations have the worst drivers, the data science team at Insurify, an auto insurance quotes comparison site, turned to its database of over 2.5 million car insurance applications. When submitting an application, drivers provide personal information and driving history, including their current occupation and any violations on their driving record. The number of motorists in each career with a prior driving violation was measured in relation to the total number of drivers in that occupation to determine the proportion of drivers with an infraction on record. The jobs with the highest share of drivers with past incidents were then selected.
To identify the most common incident type for each occupation, Insurify’s data scientists examined the proportion of drivers with a DUI, a speeding violation, or an at-fault accident against the total number of drivers in each job category. The type of infraction with the highest proportion of drivers was identified as the most common incident type for that particular occupation. The median annual wage for each specific occupation was extracted from the U.S. Bureau of Labor Statistics’ most recent estimates in May 2019.

Jobs with the Worst Drivers
10. Surveyor/Mapmaker
- Percentage of drivers with a prior incident: 34.23%
- Median annual wage: $45,010
- Most common incident: Accidents (31% higher than the national average)
Given that these drivers are geography experts, it may come as a surprise that surveyors are not the most spatially aware when on the road. Overall, surveyors accrue driving violations 25 percent more frequently than the average driver. Additionally, their most prevalent incident type is at-fault accidents; drivers that work in surveying cause accidents at a rate that exceeds the national average by 31 percent.
9. Account Collector
- Percentage of drivers with a prior incident: 34.32%
- Median annual wage: $37,000
- Most common incident: Speeding (28% higher than the national average)
Account collectors may be adept at following up with customers to track down payments, but when it comes to safe driving, they seem to be a bit less meticulous. With an overall incident rate that is 25 percent higher than the national average, account collectors are the ninth-worst drivers in the rankings. They also tend to have a need for speed: account collectors are caught violating speeding regulations at a rate that exceeds that of the average driver by 28 percent.
8. Metalworker
- Percentage of drivers with a prior incident: 34.55%
- Median annual wage: $50,400
- Most common incident: Speeding (30% higher than the national average)
Metalworkers are fundamental in ensuring the structural soundness of our infrastructure, including homes, shops, and office buildings. However, this attention to detail that they implement in their work does not always come out while driving. Metalworkers are some of the most incident-prone drivers on the road, with an overall incident rate that’s 25 percent higher than the national average. Perhaps in the rush between jobs, metalworkers most often are caught for speeding — they get cited for violating speed limits 30 percent more often than the average driver.
7. Journalist/Reporter
- Percentage of drivers with a prior incident: 34.78%
- Median annual wage: $46,270
- Most common incident: Accidents (32% higher than the national average)
Hot off the presses! In the hurry to get the scoop, journalists and reporters earned themselves the title of the seventh-worst drivers in the nation. With an overall incident rate that’s 26 percent higher than the national average, journalists and reporters are some of the worst offenders on the road. Their most prevalent violation is at-fault accidents, which they experience at a rate that eclipses the nationwide mean by 32 percent.
6. Welder
- Percentage of drivers with a prior incident: 35.20%
- Median annual wage: $42,490
- Most common incident: Speeding (37% higher than the national average)
The second metalworking job to make the list, welders have the seventh-highest overall incident rate compared to all other occupations. Welders accrue driving violations at a rate that’s 27 percent higher than the national average. Like metalworkers, welders’ most frequent violations are for speeding. The intensity required of welders when operating dangerous machinery makes for an intense day’s work, which may contribute to fatigue that affects their driving behavior.
5. Ticket Salesman
- Percentage of drivers with a prior incident: 35.36%
- Median annual wage: $31,820
- Most common incident: Speeding (36% higher than the national average)
2020 has been a notoriously poor year for ticket sales, as the pandemic has put an indefinite hold on most live-audience events. Likewise, workers in the live entertainment industry are facing a precarious future. Even so, workers in ticket and membership sales have some of the most on-road incidents, with an overall violation rate that’s 27 percent higher than the national average. These drivers are particularly prone to speeding, and they do so at a rate that surpasses the nationwide mean by 36 percent.
4. Production Crew
- Percentage of drivers with a prior incident: 35.56%
- Median annual wage: $29,800
- Most common incident: Accidents (37% higher than the national average)
The manufacturing industry has experienced profound shockwaves from the coronavirus pandemic. In some industry sectors, production has ramped up due to the influx of e-commerce demand, but other sub-industries have not been as lucky. Not only has it been a difficult year for production crew members because of 2020’s uniquely burdensome circumstances, but it has also been less-than-optimal regarding their driving patterns. Production crew members get into accidents 37 percent more often than the average driver, and all overall incidents 27 percent more often.
3. Electrician/Linesman
- Percentage of drivers with a prior incident: 35.71%
- Median annual wage: $56,180
- Most common incident: Speeding (36% higher than the national average)
Electricians may know how to fix a circuit, but their habits on the road could use some rewiring. With a violation rate that’s 28 percent higher than the national average, electricians and linesmen are the third-worst drivers in the rankings. Notably, they are also one of the two occupations on the list with a median annual wage that’s above the national average. Most frequently, electricians and linesmen are caught for violating speed limits, at a rate 36 percent higher than the typical driver’s.
2. Process Server
- Percentage of drivers with a prior incident: 36.04%
- Median annual wage: $58,400
- Most common incident: Accidents (13% higher than the national average)
Process servers fulfill an integral role in our justice system by delivering important legal papers to the corresponding parties in a litigation proceeding. Unfortunately, it seems that in the process of upholding their job’s duties, they tend to run into some hiccups on the road. Process servers have the second-highest overall incident rate among all the jobs surveyed that’s 28 percent higher than the national average. The most prominent of these violations for these drivers are accidents, which are 13 percent more prevalent than the nationwide average.
1. Bartender
- Percentage of drivers with a prior incident: 36.91%
- Median annual wage: $23,680
- Most common incident: Accidents (28% higher than the national average)
The coronavirus pandemic’s effect on bars has been unprecedented: 2020 has been the year of a gloomy closing time for bars across the country. In dozens of states, bars have been unable to fully adapt to the lockdown orders like restaurants, which offer takeout and delivery options. The pandemic has hit bartenders and other bar staff particularly hard, but bartending was not a walk in the park even before the pandemic. Factors like unconventional hours and rowdy customers are everyday stressors for bartenders, which likely contributes to the fact that their driving incident rate, which exceeds the national average by 30 percent, is the highest in the nation. Bartenders are also more likely to be on the roads late at night or when fatigued. This can explain why they are the most prone to accidents, at a rate that’s 28 percent higher than the average driver’s.
If you have questions or comments about this article, please contact insights@insurify.com.
More From 107 JAMZ
